




The real estate market is constantly sending signals. The challenge is to understand the difference between genuine distress signals and normal market fluctuations.
Changes in home values, days on market, inventory, property taxes, foreclosure activity, financing costs, and local economic conditions can all create opportunities for investors who know where to look.
This month, we've identified 10 counties where our investors have been particularly active and where we've already generated hundreds of motivated seller leads. These are homeowners who have expressed an interest in selling or working with a cash buyer.
It's one of the most common questions real estate investors ask:
“Where do I go to find motivated seller leads?”
The answer isn't always a particular property type or lead source. Sometimes, it's a market.
That's why we're looking at the top 10 counties for motivated seller activity in August 2026—and the economic and housing-market conditions that may be contributing to seller motivation in each one.
We've already generated hundreds of qualified motivated seller leads in these areas. The task now is to understand why these homeowners are willing to consider a cash offer—and reach them while the opportunity is still active.
# of Leads Generated: 589
The average home value in Wayne County is $179,490, up 1.4% over the past year, per Zillow. Home sales have taken a slight dip because of rising mortgage rates in July, 2026.
Overall, Wayne County represents a kind of balanced housing market with 6,400 homes available for sale. Around 40% of the properties sell above asking price, and the same percentage sells for below the listing price. But there are a couple of problems:
Why Motivated Sellers are Increasing:
Wayne County represents a market where the expectations simply don’t match the reality. There are three overlapping scenarios:
After spending some time in the market, homeowners adjust expectations and choose a cash sale to move forward.
# of Leads Generated: 392
The average home value in Cook County is $344,339, up 5.3% year over year. The headline number looks stable, but a second look at the market data tells a very different story: bottom-tier homes in Cook County are spending 69 days on market, and sales in that segment fell more than 6% year over year.
Why Motivated Sellers Are Increasing
# of Leads Generated: 322
The average home value in Bexar County is $256,204, down 2.2% year over year, with 58% of properties selling below listing price. Homes are taking significantly longer to sell: the median days on market are 60 days.
Bexar County is experiencing a significant property-value shift. County officials said in August that the county faces a projected $145 million budget deficit through 2028, partly because property values have stagnated after years of rapid growth.
Why Motivated Sellers Are Increasing
# of Leads Generated: 289
The average home value in Maricopa County is $460,237, down 1.3% over the past year, according to Zillow's latest county data through July 31, 2026. According to Redfin, it takes 60 days to sell a house in Maricopa, AZ, with 61% of homes selling below the asking price.
Why Motivated Sellers are Increasing:
# of Leads Generated: 283
The average home value in Lake County is $364,142, down 2.8% over the past year, according to Zillow's latest data. Homes are taking 52 days to sell, compared with 49 days a year earlier, with 23.4% of listings having price reductions.
Why Motivated Sellers are Increasing:
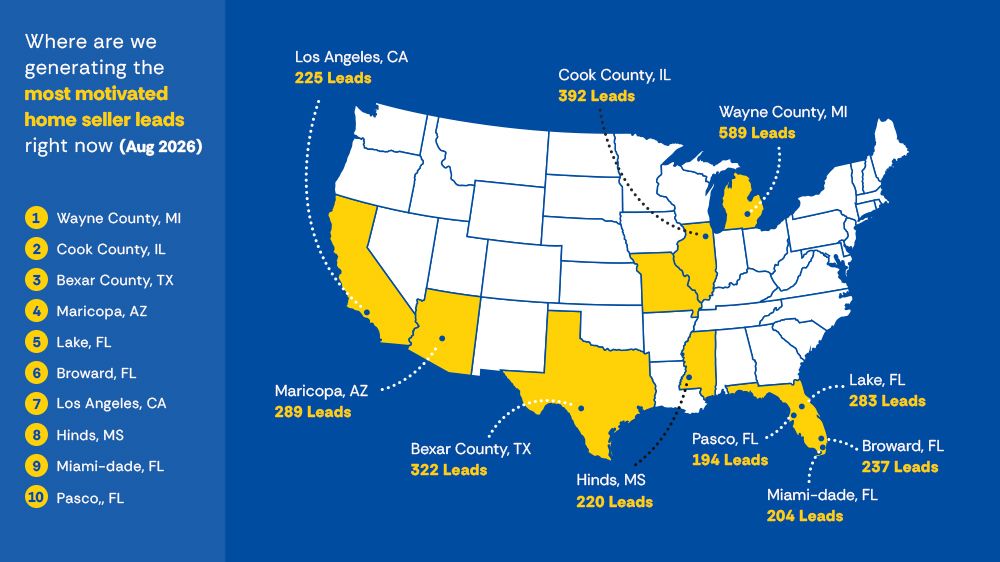
# of Leads Generated: 237
The average home value in Broward County is $425,778, down 2.8% year over year. That headline appreciation masks serious stress in specific segments. It takes more than 82 days to sell a house in Broward County, with more than 76% of properties selling below the listing price.
According to an August update, Fannie Mae is asking condominiums to set aside 15% in reserves to handle future repairs. This is particularly relevant to Broward because of its large concentration of older coastal condominium buildings. Owners facing rising HOA costs, insurance expenses, special assessments, or difficulty getting a conventional buyer financed can have a much harder time exiting the property.
Why Motivated Sellers Are Increasing
# of Leads Generated: 225
The average home value in Los Angeles County is $885,635, up 0.3% year over year. It takes 44 days to sell a house here, with around 40% of homes selling below the listing price.
Why Motivated Sellers Are Increasing
# of Leads Generated: 220
The average value of homes in Hinds County is $130,448, up 2.3% from last year. It takes 34 days to sell a house here, with 59% of homes selling below the asking price.
Why Motivated Sellers are Increasing:
# of Leads Generated: 209
The average home value in Philadelphia County is $234,557, up 0.2% year over year. It takes 47 days to sell a house, whereas around 50% of properties sell below the listing price.
Why Motivated Sellers are Increasing:
# of Leads Generated: 204
The average home value in Miami-Dade County is $523,890, down 0.8% year over year. In Miami specifically, Redfin reports a median sale price of $649,000 with homes averaging 116 days on market, up from 103 days the prior year.
In Miami-Dade County, it takes 91 days to sell a house, and more than 75% of homes are sold below the listing price.
Why Motivated Sellers are Increasing
That being said, the demand has not disappeared. It’s time for investors to find hidden opportunities in this county and expand their portfolios.
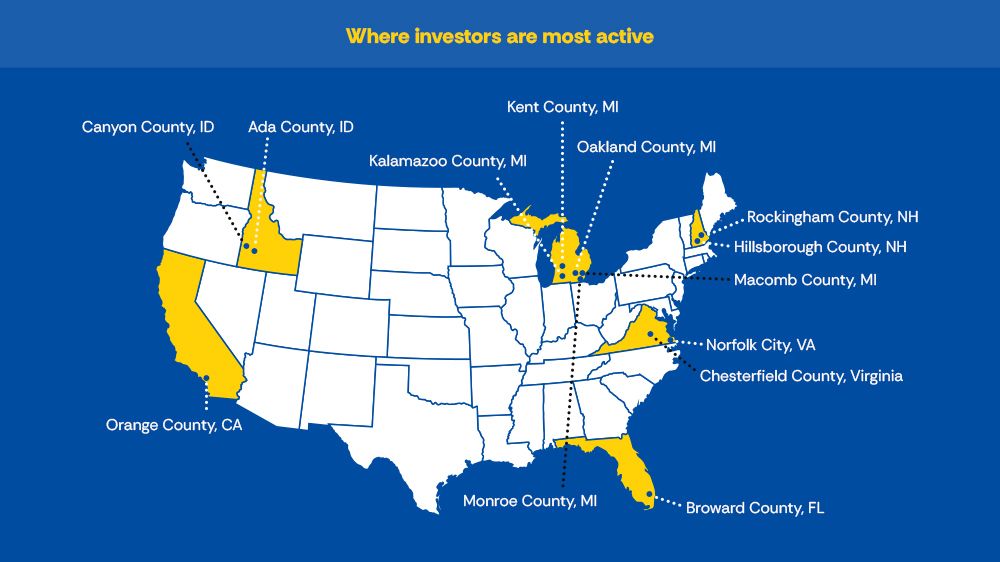
Where are real estate investors finding the most opportunities right now?
Our August 2026 activity data highlights the counties and county-equivalents where investors have been most active this month. These markets are attracting attention from investors looking for properties that may offer opportunities for cash purchases, distressed sales, motivated sellers, and off-market deals.
Where Investors Are Most Active
What do these markets have in common? Not necessarily high home prices or rapidly rising values. Investor activity can increase when homeowners face a combination of property taxes, rising ownership costs, slower sales, declining affordability, foreclosure risk, deferred maintenance, or difficulty selling traditionally.
That makes investor activity an important signal for identifying where motivated seller opportunities may be emerging in August 2026.
Data sourced from Zillow (home values), Redfin (days on market and median sale price), local foreclosure records, and current regional market reports. All figures reflect July–August 2026 data. Verify individual figures before use in offers or presentations.

Start receiving exclusive motivated seller leads delivered in real-time.

Success in real estate starts with the right leads. At MotivatedSellers.com, we provide the quality and consistency you need to close more deals.
Motivated sellers are looking for investors like you!
Contact us at
 +1 (305) 771 1557



MotivatedSellers.com is committed to digital accessibility for individuals with disabilities. We welcome feedback and accommodation requests. If you need assistance or wish to report an issue, please contact us.
Motivated Sellers is a registered trademark of Seliger Ideas Inc. and is not affiliated with MotivatedLeads.com
Copyright © 2026 Seliger Ideas Inc. All Rights Reserved.


 Your Privacy Choices